Data Visualization Techniques: Communicating Insights Effectively
Understanding the Importance of Data Visualization
Data visualization is crucial because it transforms complex data into understandable visuals. By presenting information graphically, we can identify patterns, trends, and correlations more easily than through raw data. This clarity allows decision-makers to grasp insights quickly, ultimately leading to more informed choices.
Data is the new oil, but like oil, it must be refined to be valuable.
Think of data visualization as a map: just as a map helps you navigate a new city, effective visuals guide viewers through intricate datasets. When done right, these visuals not only enhance comprehension but also engage the audience, making the data more relatable. This is especially important in today’s fast-paced world, where attention spans are short.
Related Resource
Furthermore, effective data visualization can bridge communication gaps between technical experts and non-specialists. By simplifying complex information, visuals can foster collaboration and understanding across different teams, ensuring everyone is on the same page.
Choosing the Right Visualization Type
Selecting the appropriate visualization type is key to conveying your message effectively. Bar charts, line graphs, pie charts, and scatter plots each serve different purposes, so understanding your data's story is essential. For instance, if you want to show changes over time, a line graph is typically the best choice.
Imagine you are trying to compare different categories, like sales by region. A bar chart would allow viewers to easily compare the heights of each bar to see which region performed best. On the other hand, if you need to illustrate parts of a whole, a pie chart could visually represent how each segment contributes to the overall total.
Data Visualization Simplifies Insights
Transforming complex data into visuals helps identify patterns and aids decision-making.
Ultimately, your choice of visualization should align with the data's message. The right type not only enhances understanding but also captures the audience’s attention, ensuring your insights land effectively.
Utilizing Color and Design Principles
Color is a powerful tool in data visualization, as it can evoke emotions and highlight important information. Using a consistent color scheme can help draw attention to key data points, while contrasting colors can differentiate between categories. However, it's vital to use color thoughtfully to avoid overwhelming the viewer.
The goal is to turn data into information, and information into insight.
For example, using red to indicate negative trends and green for positive trends can quickly convey the message without the need for extensive explanations. Additionally, incorporating white space can enhance readability, allowing the viewer to focus on the data without distractions.
Related Resource
Design principles such as alignment, balance, and hierarchy also play a significant role in effective visualization. By applying these principles, you create visuals that not only look good but also guide the viewer's eye to the most critical insights.
Incorporating Interactivity in Visualizations
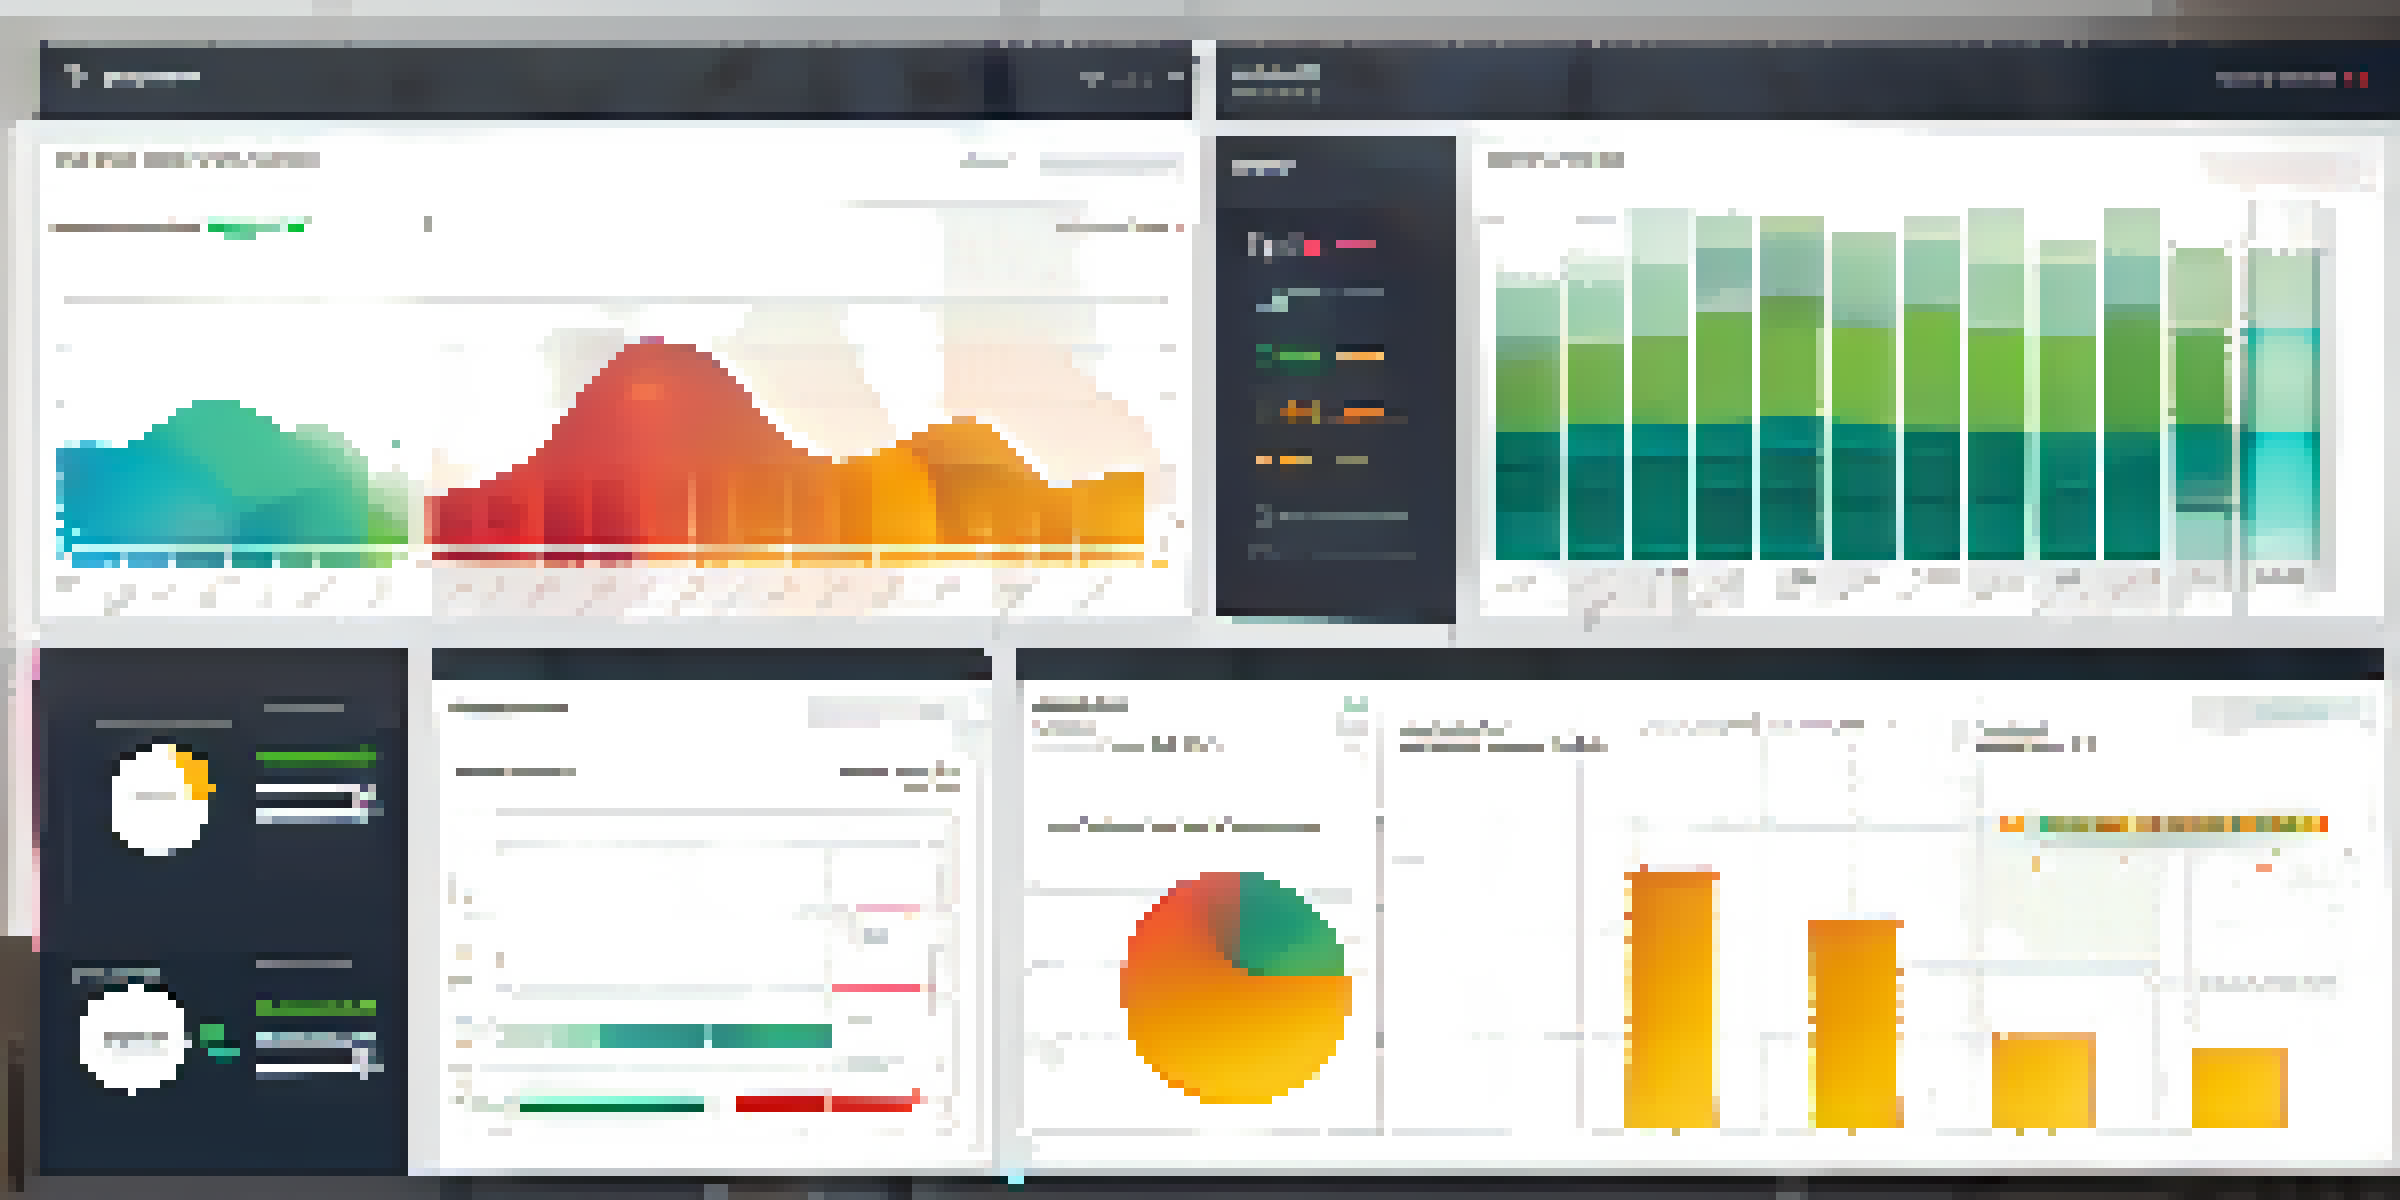
Interactivity can significantly enhance data visualization by allowing users to explore data at their own pace. When users can hover over data points for more information or filter datasets to focus on specific areas of interest, they engage with the information on a deeper level. This engagement often leads to better understanding and retention of insights.
Think of interactive dashboards, which enable users to manipulate data visualizations in real time. For instance, a sales dashboard that allows users to filter data by time periods or regions can provide tailored insights relevant to individual needs. This level of customization makes the data exploration process more personal and meaningful.
Interactivity Enhances Engagement
Allowing users to explore data interactively fosters deeper understanding and retention.
Moreover, interactive visualizations can cater to diverse audiences with varying levels of expertise. By providing different layers of information, from basic overviews to detailed analyses, you can meet the needs of both novice and expert users alike.
Storytelling with Data Visualizations
Data storytelling combines data visualization with narrative elements to create a compelling message. By weaving a story around your data, you can engage your audience emotionally and intellectually. This approach helps to contextualize the data, making it more relatable and memorable.
For instance, instead of merely presenting a chart showing declining sales, you could accompany it with a narrative explaining the factors behind the trend. This might include market changes or consumer behavior shifts, helping the audience understand the 'why' behind the numbers.
Related Resource
Effective storytelling also involves structuring your visuals to guide the viewer through the narrative. Just like a well-crafted book, your visualizations should have a clear beginning, middle, and end, leading your audience towards a conclusion or call to action.
Ensuring Accessibility in Data Visualizations
Accessibility is a critical consideration in data visualization, ensuring that everyone can understand your insights. This involves using clear labels, legible fonts, and color choices that accommodate those with color vision deficiencies. By prioritizing accessibility, you create inclusive visuals that reach a broader audience.
For example, choosing high-contrast colors and avoiding color combinations like red and green can help those with color blindness interpret your visualizations correctly. Providing alternative text descriptions for images and charts can also enhance understanding for individuals using screen readers.
Storytelling Adds Context to Data
Combining data with narrative elements makes information more relatable and memorable.
By making accessibility a priority, you not only comply with legal requirements but also demonstrate your commitment to inclusivity. This approach fosters a culture of sharing insights with everyone, regardless of their abilities.
Evaluating the Effectiveness of Your Visualizations
After creating your data visualizations, it's essential to evaluate their effectiveness in communicating insights. Gathering feedback from your audience can provide valuable insights into what works and what doesn’t. This process may involve surveys, interviews, or informal discussions to assess viewer understanding.
For instance, you might present your visualization to a test group and ask them to explain their interpretations. If they struggle to grasp the key message, it could indicate that adjustments are needed—be it in design, choice of visualization type, or even the accompanying narrative.

Continuous improvement is crucial in the world of data visualization. By regularly seeking feedback and making iterative changes, you can refine your visualizations to ensure they effectively communicate the insights you aim to share.